

Modernizing legacy systems with artificial intelligence doesn’t always require a complete overhaul. One of the most effective upgrades is computer vision, which brings real-time visibility, automation, and analytics to traditional operations.
But before any company invests in it, leaders want one clear answer: What’s the return on investment (ROI)?
Calculating computer vision ROI in legacy systems helps organizations understand not only cost savings but also the strategic value of smarter operations, reduced downtime, and enhanced quality control. Let’s break down how to measure it accurately and maximize the benefits.
Understanding Computer Vision ROI
ROI, or Return on Investment, measures how much value a project delivers compared to its total cost.
In the case of computer vision, ROI extends beyond direct financial gains. It includes:
- Efficiency improvements
- Error and defect reduction
- Enhanced safety and compliance
- Better decision-making from visual insights
A successful implementation improves both top-line performance (revenue growth) and bottom-line results (cost reduction).
Why Calculating ROI in Legacy Systems Is Different
Legacy systems come with unique challenges—limited hardware capacity, outdated interfaces, and rigid processes. Yet they also hold years of valuable operational data.
Measuring ROI here involves balancing innovation with preservation. The goal is to prove that computer vision enhances performance without replacing the existing infrastructure.
That means evaluating ROI not only in financial terms but also in how seamlessly AI integrates with older workflows.
Key ROI Metrics for Computer Vision in Legacy Environments
To quantify value, focus on measurable outcomes. The most common ROI metrics include:
- Cost Savings from Automation
- Reduced manual inspection or data entry labor.
- Lower maintenance and rework costs.
- Quality Improvements
- Fewer defects or process errors through visual detection.
- Consistent output and product accuracy.
- Operational Efficiency
- Faster process cycles and reduced downtime.
- Better asset utilization.
- Safety and Compliance Gains
- Reduced workplace incidents or violations.
- Avoided regulatory fines and reputational risks.
- Revenue Growth
- Improved customer satisfaction due to higher product quality.
- Shorter lead times creating faster sales cycles.
These quantifiable benefits form the foundation of ROI analysis.
1. Identifying Cost Components
To calculate ROI correctly, first determine the full cost of your computer vision project.
Typical cost components include:
- Hardware: Cameras, sensors, and edge devices.
- Software: Vision algorithms, licensing, and integration tools.
- Infrastructure: Cloud storage, network upgrades, or local servers.
- Labor: Training staff, data labeling, and IT maintenance.
- Deployment & Support: Installation, testing, and vendor support contracts.
Document all costs upfront for a complete picture of your investment.
2. Calculating Basic ROI Formula
Use the standard ROI formula as your starting point:
ROI (%) = [(Total Benefits – Total Costs) / Total Costs] × 100
Example:
- Total Costs: $250,000
- Annual Benefits: $500,000
ROI = [(500,000 – 250,000) / 250,000] × 100 = 100%
A 100% ROI means your investment pays for itself within one year—an ideal scenario in industrial automation.
3. Evaluating Efficiency Improvements
Computer vision drastically reduces human error and time spent on manual tasks.
Example:
If a factory inspection team spends 2,000 hours per year manually reviewing products at $25/hour, automation that reduces review time by 60% saves:
2,000 × $25 × 0.60 = $30,000 annually
These savings are direct, measurable, and contribute significantly to ROI.
4. Quantifying Quality and Defect Reduction
Every defective product costs money—both in materials and brand reputation.
Let’s say your defect rate drops from 5% to 1% after implementing computer vision in quality control.
- Annual production: 200,000 units
- Average cost per defect: $10
Savings = (0.05 – 0.01) × 200,000 × $10 = $80,000
Reducing errors directly boosts profitability and customer satisfaction.
5. Measuring Downtime Reduction
Legacy systems often suffer from unpredictable failures. Real-time vision monitoring can detect anomalies early, reducing unplanned downtime.
If your downtime costs $2,000/hour and computer vision prevents 50 hours of downtime yearly:
Savings = 50 × $2,000 = $100,000
Preventive insights like these create tangible ROI and operational stability.
6. Safety and Compliance ROI
Accidents can cost thousands in insurance, legal fees, and downtime. Computer vision helps detect unsafe behavior—like missing safety gear or hazardous conditions—before accidents occur.
Example:
If AI monitoring prevents even one $50,000 safety incident annually, that’s a direct ROI contribution beyond efficiency gains.
7. Calculating Payback Period
The payback period determines how long it takes to recover your investment.
Payback Period = Total Cost / Annual Benefit
For instance, if your project cost $250,000 and you save $125,000 annually:
Payback Period = 250,000 / 125,000 = 2 years
Shorter payback periods (under 3 years) generally indicate a strong return.
8. Incorporating Indirect Benefits
Some returns aren’t easily measured in dollars but still matter:
- Improved employee morale due to reduced repetitive work.
- Faster decision-making from real-time visual data.
- Enhanced brand reputation for innovation and reliability.
These intangible benefits contribute to long-term ROI and competitive advantage.
9. Using Predictive Analytics for ROI Forecasting
Computer vision systems often improve over time. Use predictive analytics to estimate future returns as accuracy and efficiency increase.
Forecast ROI across 3–5 years, accounting for:
- Performance improvements in AI models.
- Reduced maintenance as processes stabilize.
- Expanding applications (e.g., extending vision to new departments).
This forward-looking approach provides a realistic long-term ROI estimate.
10. Aligning ROI with Business Goals
ROI isn’t just about savings—it’s about strategic alignment.
Ask:
- Does computer vision support our digital transformation roadmap?
- Does it enable safer, faster, or more sustainable operations?
- Can it improve customer experience or product consistency?
When ROI aligns with key business metrics, adoption becomes a long-term success driver.
Alt text: computer vision ROI legacy systems visual dashboard showing savings and efficiency metrics
11. Building a Data-Driven ROI Dashboard
A centralized ROI dashboard helps track both financial and operational performance.
Include KPIs like:
- Cost savings vs. baseline
- Defect detection accuracy
- Production cycle efficiency
- Downtime reduction trends
Automating ROI tracking ensures transparency and makes it easier to demonstrate success to stakeholders.
12. Overcoming Common ROI Calculation Challenges
While calculating ROI, avoid these pitfalls:
- Ignoring indirect benefits like safety and morale.
- Underestimating maintenance costs of AI infrastructure.
- Using short timeframes that overlook long-term improvements.
- Neglecting integration costs with legacy systems.
A balanced, data-backed approach yields a truer measure of success.
13. Leveraging Hybrid Architectures for ROI Optimization
Combining edge processing with cloud analytics maximizes ROI. Edge AI provides fast, local decisions, while the cloud handles scalability and insights.
This hybrid setup reduces costs by minimizing bandwidth usage while improving accuracy through continuous updates.
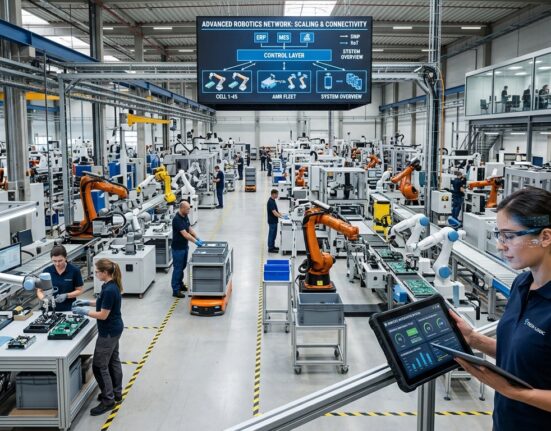
Alt text: hybrid edge and cloud system optimizing computer vision ROI in legacy environments
14. Case Example: ROI in Manufacturing
A manufacturing company integrated computer vision for automated defect detection.
- Investment: $300,000
- Annual Savings:
- Labor: $50,000
- Scrap reduction: $100,000
- Downtime savings: $75,000
- Quality improvement: $25,000
- Total = $250,000/year
ROI = [(250,000 – 300,000) / 300,000] × 100 = -17% (Year 1)
ROI (Year 2) = 250,000 / 300,000 × 100 = 83% cumulative
By Year 2, the system achieved profitability and continued to scale across other production lines.
15. Reporting ROI to Stakeholders
Present ROI results clearly to executives and teams using:
- Visual dashboards showing measurable gains.
- Before-and-after metrics with real images or case data.
- Stories highlighting employee productivity or safety improvements.
Effective reporting builds confidence and supports future AI investments.
Conclusion: Turning Vision into Value
Calculating computer vision ROI in legacy systems is about more than numbers—it’s about proving that modernization doesn’t require replacement.
By tracking costs, measuring benefits, and aligning outcomes with strategic goals, organizations can unlock significant value from their existing infrastructure.
When implemented thoughtfully, computer vision transforms legacy systems into intelligent, high-performing assets—delivering both financial returns and future readiness.
FAQ
1. How do you calculate ROI for computer vision projects?
Use the formula [(Total Benefits – Total Costs) / Total Costs] × 100, including both direct and indirect gains.
2. What are the biggest ROI drivers for computer vision?
Automation, defect reduction, downtime prevention, and improved safety are the primary ROI factors.
3. Can legacy systems handle computer vision?
Yes. With edge computing and lightweight AI models, legacy systems can integrate vision-based monitoring efficiently.
4. How long does it take to see ROI?
Most projects show measurable returns within 12–24 months, depending on scale and complexity.
5. What’s the best way to present ROI to leadership?
Use clear metrics, visual dashboards, and real-world success stories that connect performance data with business goals.